导读
如何观察磁盘的IO利用率以及饱和度?
看文本文给你解药!
翻译团队:知数堂藏经阁项目 – 菜鸟盟
团队成员:菜鸟盟–hades、菜鸟盟-bruce、菜鸟盟-冰焰
译文校稿:叶师傅
原文出处:https://www.percona.com/blog/2017/08/28/looking-disk-utilization-and-saturation/
原文作者:Peter Zaitsev (Percona CEO)
在这篇文章里,会介绍磁盘利用率和饱和度相关的知识。
In this blog post, I will look at disk utilization and saturation.
在之前的博客里面,我写了一些关于CPU使用率和饱和度之间有什么实质性不同,以及CPU使用率、饱和度如何从不同维度影响响应时间(RT)的文章。
现在我们来看另一个影响数据库性能重要因素:存储子系统。在下面文章里,我会用“磁盘”代替存储子系统。
In my previous blog post, I wrote about CPU utilization and saturation, the practical difference between them and how different CPU utilization and saturation impact response times.
Now we will look at another critical component of database performance: the storage subsystem. In this post, I will refer to the storage subsystem as “disk” (as a casual catch-all).
监控IO性能最常用的工具是iostat,会显示如下的信息:
The most common tool for command line IO performance monitoring is iostat, which shows information like this:
root@ts140i:~# iostat -x nvme0n1 5
Linux 4.4.0-89-generic (ts140i)         08/05/2017      _x86_64_        (4 CPU)

avg-cpu:  %user   %nice %system %iowait  %steal   %idle
          0.51    0.00    2.00    9.45    0.00   88.04

Device:         rrqm/s   wrqm/s     r/s     w/s    rkB/s    wkB/s avgrq-sz avgqu-sz   await r_await w_await  svctm  %util
nvme0n1           0.00     0.00 3555.57 5887.81 52804.15 87440.73    29.70     0.53    0.06    0.13    0.01   0.05  50.71

avg-cpu:  %user   %nice %system %iowait  %steal   %idle
          0.60    0.00    1.06   20.77    0.00   77.57

Device:         rrqm/s   wrqm/s     r/s     w/s    rkB/s    wkB/s avgrq-sz avgqu-sz   await r_await w_await  svctm  %util
nvme0n1           0.00     0.00 7612.80    0.00 113507.20     0.00    29.82     0.97    0.13    0.13    0.00   0.12  93.68

avg-cpu:  %user   %nice %system %iowait  %steal   %idle
          0.50    0.00    1.26    6.08    0.00   92.16

Device:         rrqm/s   wrqm/s     r/s     w/s    rkB/s    wkB/s avgrq-sz avgqu-sz   await r_await w_await  svctm  %util
nvme0n1           0.00     0.00 7653.20    0.00 113497.60     0.00    29.66     0.99    0.13    0.13    0.00   0.12  93.52
第一行(avg-cpu)显示的是自系统启动之后平均的性能。某些情况下,用当前系统的压力和平均性能作对比是很有用的。这篇文章的案例是测试环境,所以可以忽略对比这两种情况。
第二行(Device)显示的当前5秒钟的性能指标(在命令行中指定了每5秒输出一次)。
The first line shows the average performance since system start. In some cases, it is useful to compare the current load to the long term average. In this case, as it is a test system, it can be safely ignored. The next line shows the current performance metrics over five seconds intervals (as specified in the command line).
iostat命令用%util列显示利用率的信息,可以通过观察平均请求队列大小(the avgqu-sz 列)或者通过r_await和w_await列(显示平均的读和写的等待)来观察IO饱和度。如果超过正常值,设备就会过度饱和了。
The iostat command reports utilization information in the %util column, and you can look at saturation by either looking at the average request queue size (the avgqu-sz column) or looking at the r_await and w_await columns (which show the average wait for read and write operations). If it goes well above “normal” then the device is over-saturated.
和之前的文章一样,我们会执行Sysbench,然后观察iostat命令、Percona PMM的输出。
As in my previous blog post, we’ll perform some system Sysbench runs and observe how the iostat command line tool and Percona Monitoring and Management graphs behave.
我们用Sysbench测试文件IO,以便观察磁盘的变化。我创建了一个100GB的文件,因为用了DirectIO方式所以所有的请求都会直接打到磁盘。我也会用”sync”刷新模式以便更好的控制IO请求的并发度。
To focus specifically on the disk, we’re using the Sysbench fileio test. I’m using just one 100GB file, as I’m using DirectIO so all requests hit the disk directly. I’m also using “sync” request submission mode so I can get better control of request concurrency.
在这个实验中我用了一个Intel 750 NVME固态硬盘(虽然这并不重要)。
I’m using an Intel 750 NVME SSD in this test (though it does not really matter).
Sysbench FileIO 1线程
    root@ts140i:/mnt/data# sysbench  --threads=1 --time=600 --max-requests=0  fileio --file-num=1 --file-total-size=100G --file-io-mode=sync --file-extra-flags=direct --file-test-mode=rndrd run

    File operations:
       reads/s:                      7113.16
       writes/s:                     0.00
       fsyncs/s:                     0.00

    Throughput:
       read, MiB/s:                  111.14
       written, MiB/s:               0.00

    General statistics:
       total time:                          600.0001s
       total number of events:              4267910

    Latency (ms):
            min:                                  0.07
            avg:                                  0.14
            max:                                  6.18
            95th percentile:                      0.17
单线程测试结果通常可以作为基线,通常只有一个请求时的响应时间通常也最快(不过一般也不是最佳吞吐量)。
A single thread run is always great as a baseline, as with only one request in flight we should expect the best response time possible (though typically not the best throughput possible).
Iostat
Device:         rrqm/s   wrqm/s     r/s     w/s    rkB/s    wkB/s avgrq-sz avgqu-sz   await r_await w_await  svctm  %util
nvme0n1           0.00     0.00 7612.80    0.00 113507.20     0.00    29.82     0.97    0.13    0.13    0.00   0.12  93.68
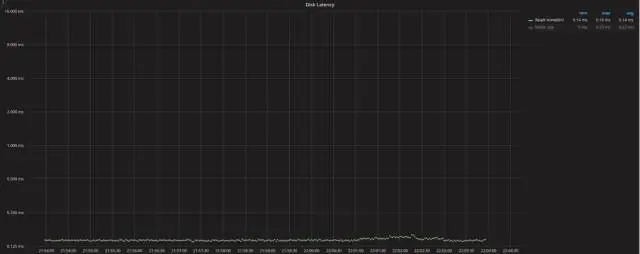
磁盘读写延迟
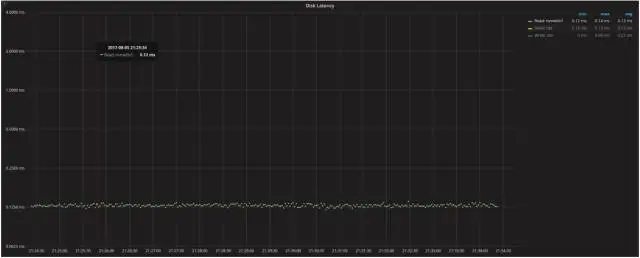
磁盘延迟图像证实了我们从iostat命令看到的磁盘IO延迟,它指定了特定设备。我们用它作为基线和更高并发做对比。
The Disk Latency graph confirms the disk IO latency we saw in the iostat command, and it will be highly device-specific. We use it as a baseline to compare changes to with higher concurrency.
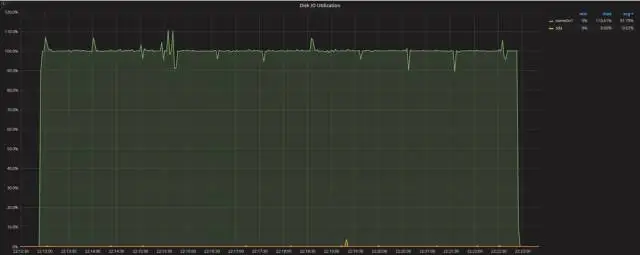
磁盘IO使用率
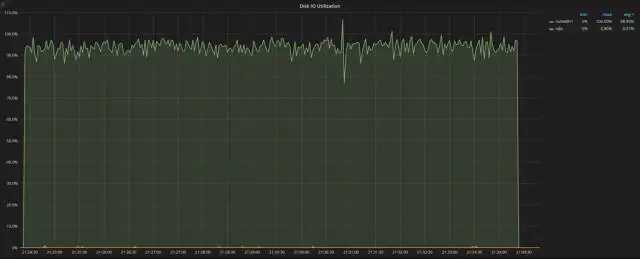
即便我们只发起一个IO请求(队列深度),但磁盘IO使用率已很接近100%。这个是linux磁盘使用率显示的问题,它不像CPU利用率,由于IO设备的特殊设计机制linux不能直接显示其利用率。它真正有多少可执行单元?他们是怎么被使用的?当做了raid后,每个物理磁盘都可以被视为单独的执行单元,而SSD磁盘以及云存储(比如EBS)则可能有更多执行单元。
Disk IO utilization is close to 100% even though we have just one outstanding IO request (queue depth). This is the problem with Linux disk utilization reporting: unlike CPUs, Linux does not have direct visibility on how the IO device is designed. How many “execution units” does it really have? How are they utilized? Single spinning disks can be seen as a single execution unit while RAID, SSDs and cloud storage (such as EBS) are more than one.
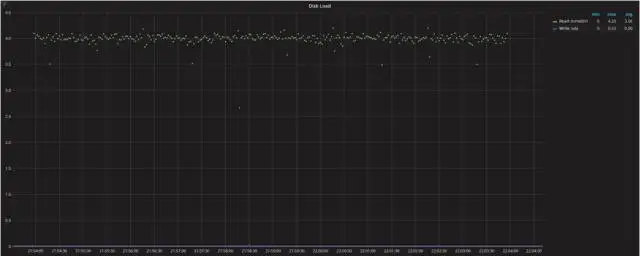
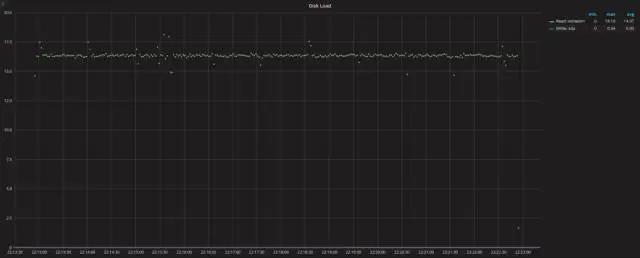
磁盘负载
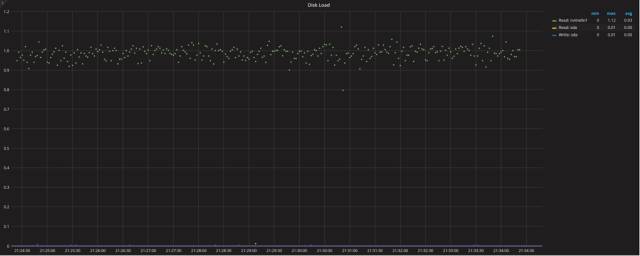
这个图片显示磁盘负载(或者请求队列大小),它和实际压到磁盘上线程的数量是大致匹配的。
This graph shows the disk load (or request queue size), which roughly matches the number of threads that are hitting disk as hard as possible.
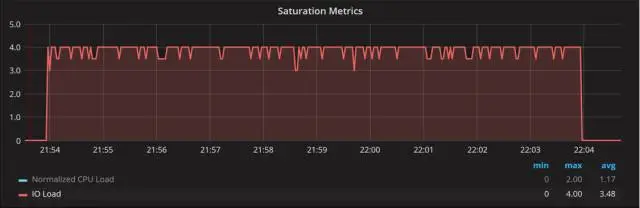
饱和度(IO压力)
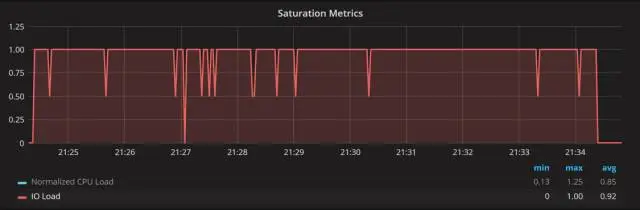
饱和度指标图上的IO负载几乎显示了相同的数值。唯一的不同是不像磁盘IO统计信息一样,它显示了整个系统的概要。
The IO load on the Saturation Metrics graph shows pretty much the same numbers. The only difference is that unlike Disk IO statistics, it shows the summary for the whole system.
Sysbench FileIO 4线程
现在让我们把IO提高到四个并发线程,再来看看磁盘的情况:
Now let’s increase IO to four concurrent threads and see how disk responds:
root@ts140i:/mnt/data# sysbench  --threads=4 --time=600 --max-requests=0  fileio --file-num=1 --file-total-size=100G --file-io-mode=sync --file-extra-flags=direct --file-test-mode=rndrd run

    File operations:
       reads/s:                     26248.44
       writes/s:                    0.00
       fsyncs/s:                    0.00
    Throughput:
       read, MiB/s:                  410.13
       written, MiB/s:               0.00
    General statistics:
       total time:                                       600.0002s
       total number of events:                 15749205
    Latency (ms):
            min:                                  0.06
            avg:                                  0.15
            max:                                 8.73
            95th percentile:               0.21
我们看到请求数量线性增加,而请求延迟变化却很小:0.14ms vs 0.15ms。这表明设备内部有足够的执行单元并行处理负载,而且不存在其他瓶颈(如连接接口)。
We can see the number of requests scales almost linearly, while request latency changes very little: 0.14ms vs. 0.15ms. This shows the device has enough execution units internally to handle the load in parallel, and there are no other bottlenecks (such as the connection interface).
Iostat
Device:        rrqm/s   wrqm/s     r/s     w/s    rkB/s    wkB/s avgrq-sz avgqu-sz   await r_await   w_await  svctm  %util
nvme0n1       0.00    0.00  28808.60    0.00   427668.00     0.00    29.69     4.05    0.14    0.14    0.00   0.03  99.92
磁盘读写延迟
磁盘IO使用率

磁盘负载
饱和度(IO压力)
Sysbench FileIO 16线程
root@ts140i:/mnt/data# sysbench  --threads=16 --time=600 --max-requests=0  fileio --file-num=1 --file-total-size=100G --file-io-mode=sync --file-extra-flags=direct --file-test-mode=rndrd run

    File operations:
       reads/s:                    76845.96
       writes/s:                     0.00
       fsyncs/s:                    0.00
    Throughput:
       read, MiB/s:                  1200.72
       written, MiB/s:                0.00
    General statistics:
       total time:                          600.0003s
       total number of events:              46107727
    Latency (ms):
            min:                                  0.07
            avg:                                  0.21
            max:                                  9.72
            95th percentile:                 0.36
从4个线程到16个线程,我们再次看到吞吐量有较大提升而响应时间只轻微变大。如果你仔细观察结果,你将注意到一个更有趣的事情:平均响应时间从0.15ms增加到0.21ms(增加了40%),而95%的响应时间从0.21ms增加到0.36 ms(增加了71%)。我还进行了一个单独的测试来测量99%的响应时间,发现差异甚至更大:0.26ms vs 0.48ms(增加了84%)。
Going from four to 16 threads, we again see a good throughput increase with a mild response time increase. If you look at the results closely, you will notice one more interesting thing: the average response time has increased from 0.15ms to 0.21ms (which is a 40% increase), while the 95% response time has increased from 0.21ms to 0.36ms (which is 71%). I also ran a separate test measuring 99% response time, and the difference is even larger: 0.26ms vs. 0.48ms (or 84%).
这是一个重要的观察:一旦趋于饱和,方差可能会增加,而且其中一些请求会受到不同程度的影响(不仅仅只是我们看到的平均响应时间)。
This is an important observation to make: once saturation starts to happen, the variance is likely to increase and some of the requests will be disproportionately affected (beyond what the average response time shows).
Iostat
Device:         rrqm/s   wrqm/s     r/s     w/s    rkB/s    wkB/s avgrq-sz avgqu-sz   await r_await w_await  svctm  %util
nvme0n1           0.00     0.00 82862.20    0.00 1230567.20     0.00    29.70    16.33    0.20    0.20    0.00   0.01 100.00
磁盘读写延迟

磁盘IO使用率
磁盘负载
饱和度(IO压力)

上面的图表结果符合预期:磁盘负载和IO负载从基本饱和增长到约为16,磁盘IO利用率则保持在100%。
The graphs show an expected figure: the disk load and IO load from saturation are up to about 16, and utilization remains at 100%.
需要注意的是图形中的抖动有所增加。IO利用率飙到100%以上,磁盘IO负载峰值上升到18,而请求队列却并不是很大。这就需要先从这些信息如何去收集的角度去考虑问题。尝试每秒对这些数据进行采样,但是在有实际负载的系统中,这个采集进程也需要费些时间:我们本来希望每秒采集一次数据,而实际上间隔则是1.05 ~ 0.95秒。当数学应用于数据采集时,我们所看到的图表中就可能会有本不应该出现的波峰、波谷(或刺点)。所以从大的角度来看,是可以忽略这些波动的。
One thing to notice is increased jitter in the graphs. IO utilization jumps to over 100% and disk IO load spikes to 18, when there should not be as many requests in flight. This comes from how this information is gathered. An attempt is made to sample this data every second, but with the loaded system it takes time for this process to work: sometimes when we try to get the data for a one-second interval but really get data for 1.05- or 0.95-second intervals. When the math is applied to the data, it creates the spikes and dips in the graph when there should be none. You can just ignore them if you’re looking at the big picture.
Sysbench FileIO 64 Threads
最后,让我们用sysbench跑64个并发线程的情况:
Finally, let’s run sysbench with 64 concurrent threads hitting the disk:
root@ts140i:/mnt/data# sysbench  --threads=64 --time=600 --max-requests=0  fileio --file-num=1 --file-total-size=100G --file-io-mode=sync --file-extra-flags=direct --file-test-mode=rndrd run

    File operations:
       reads/s:                      127840.59
       writes/s:                     0.00
       fsyncs/s:                     0.00

    Throughput:
       read, MiB/s:                  1997.51
       written, MiB/s:               0.00

    General statistics:
       total time:                          600.0014s
       total number of events:              76704744

    Latency (ms):
            min:                                  0.08
            avg:                                  0.50
            max:                                  9.34
            95th percentile:                      1.25
我们可以看到平均响应耗时从0.21ms上升到0.50ms(两倍多),此外95%的响应时间从0.36ms跃升到1.25ms。实际上,我们可以看到IO负载开始饱和了,以前我们看到随着CPU饱和度的增加,并发线程数越多则响应耗时也越久,但这次随着并发线程数的增加,我们并未看到响应耗时随着线性增加。猜测是因为我们测试IO设备有不错的内部IO并行能力,所以响应请求效率很高(即便并发线程从16增加到64)。
We can see the average has risen from 0.21ms to 0.50 (more than two times), and 95% almost tripped from 0.36ms to 1.25ms. From a practical standpoint, we can see some saturation starting to happen, but we’re still not seeing a linear response time increase with increasing numbers of parallel operations as we have seen with CPU saturation. I guess this points to the fact that this IO device has a lot of parallel capacity inside and can process requests more effectively (even going from 16 to 64 concurrent threads).
在这个测试中,当我们将并发性从1个增加到64个时,我们看到响应耗时从0.14ms增加到0.5ms(约三倍)。此时95%的响应耗时从0.17ms增加到1.25ms(约七倍)。实际上,从这时开始看到IO设备趋于饱和了。
Over the series of tests, as we increased concurrency from one to 64, we saw response times increase from 0.14ms to 0.5ms (or approximately three times). The 95% response time at this time grew from 0.17ms to 1.25ms (or about seven times). For practical purposes, this is where we see the IO device saturation start to show.
Iostat
Device:         rrqm/s   wrqm/s     r/s     w/s    rkB/s    wkB/s avgrq-sz avgqu-sz   await r_await   w_await  svctm  %util
nvme0n1           0.00     0.00 138090.20    0.00   2049791.20     0.00    29.69    65.99    0.48    0.48    0.00   0.01 100.24
我们将略过相关图表,因为它们基本雷同,只是在64并发线程下有更高的延迟。
We’ll skip the rest of the graphs as they basically look the same, just with higher latency and 64 requests in flight.
Sysbench FileIO 256线程
    root@ts140i:/mnt/data# sysbench  --threads=256 --time=600 --max-requests=0  fileio --file-num=1 --file-total-size=100G --file-io-mode=sync --file-extra-flags=direct --file-test-mode=rndrd run

    File operations:
       reads/s:                      131558.79
       writes/s:                     0.00
       fsyncs/s:                     0.00

    Throughput:
       read, MiB/s:                  2055.61
       written, MiB/s:               0.00

    General statistics:
       total time:                          600.0026s
       total number of events:              78935828

    Latency (ms):
            min:                                  0.10
            avg:                                  1.95
            max:                                 17.08
            95th percentile:                      3.89
Iostat
Device:         rrqm/s   wrqm/s     r/s     w/s    rkB/s    wkB/s avgrq-sz avgqu-sz   await r_await w_await  svctm  %util
nvme0n1           0.00     0.00 142227.60    0.00 2112719.20     0.00    29.71   268.30    1.89    1.89    0.00   0.0
最后,当并发256个线程时,从平均响应耗时的线性增长结果表明了设备已经过载,且IO请求开始排队。这里没有简单的办法判断它是由于IO总线饱和(此时IO读速率为2GB/sec),还是由于设备内部处理能力所限导致的。
With 256 threads, finally we’re seeing the linear growth of the average response time that indicates overload and queueing to process requests. There is no easy way to tell if it is due to the IO bus saturation (we’re reading 2GB/sec here) or if it is the internal device processing ability.
正如我们所见,并发数从16个到64个时,响应耗时小于线性增长,当从64到256则是线性增长,我们可以看到这个设备最佳的并发是介于16个和64之间。这时的吞吐量可以达到峰值,且没有大量的请求排队。
As we’ve seen a less than linear increase in response time going from 16 to 64 connections, and a linear increase going from 64 to 256, we can see the “optimal” concurrency for this device: somewhere between 16 and 64 connections. This allows for peak throughput without a lot of queuing.
在总结之前,我想对这次特别的测试先做一个重要的说明。这是个随机读的测试,对于很多数据库来说是个重要的工作负载模式,但可能不是最主要负载场景。可能是写为主,或者顺序IO读 (则会有相应不同的表现)。对于其它的工作负载模式,我希望本文可以帮助你在分析时提供些参考、思路。
Before we get to the summary, I want to make an important note about this particular test. The test is a random reads test, which is a very important pattern for many database workloads, but it might not be the dominant load for your environment. You might be write-bound as well, or have mainly sequential IO access patterns (which could behave differently). For those other workloads, I hope this gives you some ideas on how to also analyze them.
另一种思考饱和度的方法
Another Way to Think About Saturation
当我问起他Percona的同学对本文的反馈意见时,Yves Trudeau同学提供了另外一种思考饱和度的方法:与单线程模式相比,平均响应耗时的增长百分比作为饱和度的衡量指标 。例如:
When I asked the Percona staff for feedback on this blog post by, my colleague Yves Trudeau provided another way to think about saturation: measure saturation as percent increase in the average response time compared to the single user. Like this:
| Threads |
Avg Response Time |
Saturation |
| 1 |
0.14 |
– |
| 4 |
0.15 |
1.07x or 7% |
| 16 |
0.21 |
1.5x or 50% |
| 64 |
0.50 |
3.6x or 260% |
| 256 |
1.95 |
13.9x or 1290% |
总结
Summary
- 我们可以看到如何理解磁盘利用率和饱和度要比CPU复杂的多;
- We can see how understanding disk utilization and saturation is much more complicated than for the CPU:
- 利用率指标(由iostat和PMM输出的%Util)对理解真实的IO设备利用率是没啥作用。因为它只是衡量在运行中至少有一个请求时的耗时。如果是CPU的这个指标,它将相当于运行在至少一个核上(对于高度并发系统不是很有用);
- The Utilization metric (as reported by iostat and by PMM) is not very helpful for showing true storage utilization, as it only measures the time when there is at least one request in flight. If you had the same metric for the CPU, it would correspond to something running on at least one of the cores (not very useful for highly parallel systems).
- 不同于CPU,Linux工具不给我们提供关于存储设备的底层结构和在不饱和的情况下还可以处理多少并行负载的信息。更甚的是,存储设备可能有不同的底层源头会导致饱和。例如,它可能是网络连接,SATA总线,甚至是老内核的内核IO栈去处理高速存储设备(译者注:跟不上时代发展啦)。
- Unlike a CPU, Linux tools do not provide us with information about the structure of the underlying storage and how much parallel load it should be able to handle without saturation. Even more so, storage might well have different low-level resources that cause saturation. For example, it could be the network connection, SATA BUS or even the kernel IO stack for older kernels and very fast storage.
- 根据运行中的请求数量来测量饱和有助于判断是否饱和,但是由于我们不知道设备可以高效的并发处理多少请求,只看基础指标我们不能确定设备是否过载;
- Saturation as measured by the number of requests in flight is helpful for guessing if there might be saturation, but since we do not know how many requests the device can efficiently process concurrently, just looking the raw metric doesn’t let us determine that the device is overloaded
- 平均响应耗时对于观察饱和度是一个很好的指标,但是和响应耗时一样,您无法判断这个设备的响应耗时是高是低。您需要在上下文中查看它并将其与基线进行比较。当你查看平均响应耗时时,确保你分别查看读响应时间和写响应时间,并且记下平均请求队列大小以确保是相同角度的比较。
- Avg Response Time is a great metric for looking at saturation, but as with the response time you can’t say what response time is good or bad for this device. You need to look at it in context and compare it to the baseline. When you’re looking at the Avg Response Time, make sure you’re looking at read request response time vs. write request response time separately, and keep the average request size in mind to ensure we are comparing apples to apples.